
In April, I started this blog as a way to share what I was learning on my data science journey. As we arrive at the end of 2019, I wanted to take this opportunity to thank everyone who has read my blog and reached out with questions and comments and to those who have shared my posts as well. It’s great being able to share this journey with everyone, and is something I plan on continuing in the coming year.
With that being said, I thought I would share some statistics and insights about my blog in 2019. As an SEO, I love exploring web analytics, so why not take a look at the analytics for my own blog?
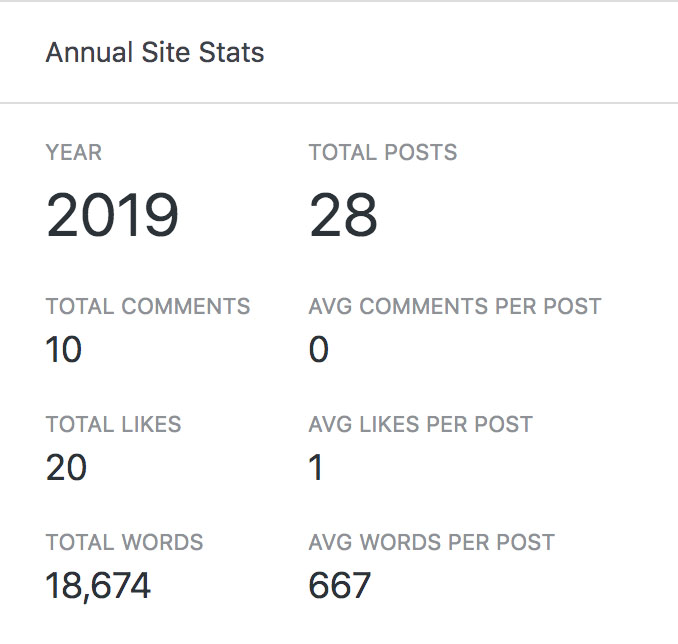
This year, I published a total of 28 posts with a total of 18,674 words published and an average of 667 words per post. This blog received a total of 10 comments and 20 likes while obtaining 13 followers on WordPress.
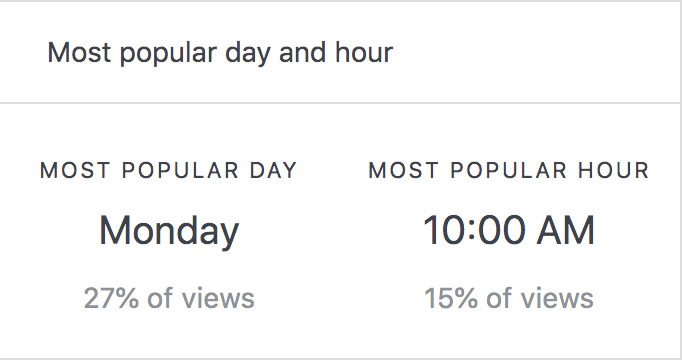
27% of views were on a Monday with 15% of views at 10am. This is expected as most posts were published on a Sunday afternoon.
As mentioned, I started this blog in April, so it is interesting to see how traffic to the blog changed month over month (MoM):
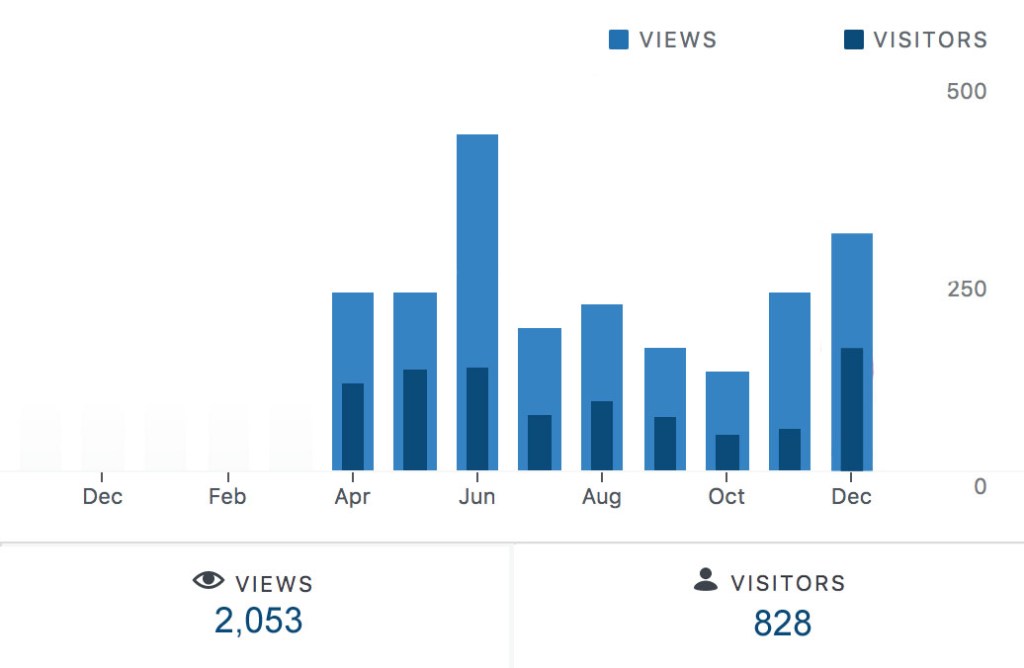
The blogs best months were June, with 128 visitors and 425 views, and December, with 154 visitors and 297 views. Of course, there are many factors that could affect MoM traffic to the blog like the fact that I did not publish the same number of posts each month, some posts were promoted more than others..etc.
Looking at the entire year, the blog had a total of 828 visitors and 2,053 views. The blogs best day was December 9, 2019, when the “Keyword Clustering for SEO with R” post was published.
With that, let’s move into the top 10 landing pages/posts on the website:
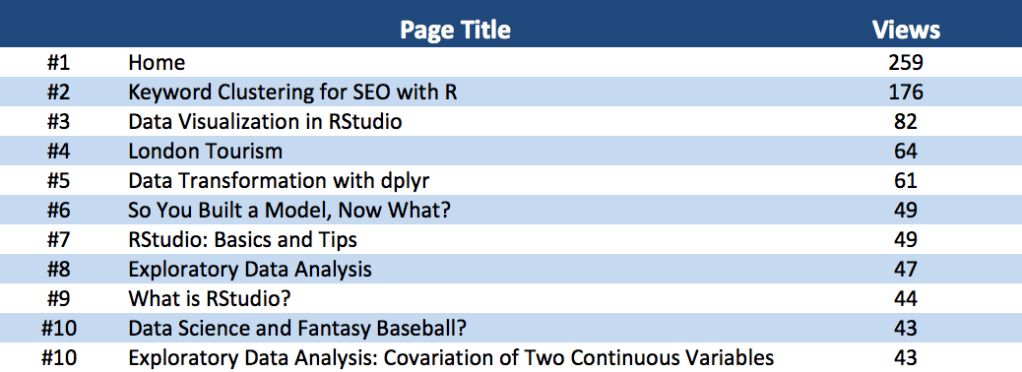
The blogs homepage had the most views, which is not surprising as it is the main page on the website, and is the page that is most shared. The “Keyword Clustering for SEO with R” and “Data Visualization in RStudio” posts rounded out the top three landing pages, which is interesting because they are both my latest post and first post published, respectively.
Now, it is time to look at where traffic to the site is coming from:
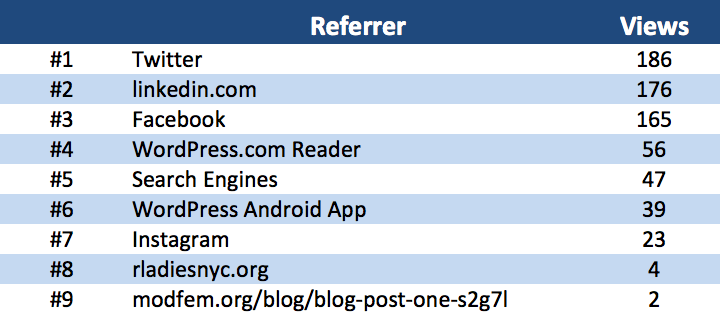
I share all of my posts on Twitter, LinkedIn and Facebook, so it is not surprising that 75% of views came from the links shared on these three sites. WordPress, the content management system that this blog uses, also brought traffic to the blog. Lastly, in #8 	 are R-Ladies NYC and Modern Feminist, two organizations that have shared my posts on their websites also driving some traffic to the blog.
And finally, let’s take a look at where in the world people have viewed the blog from:
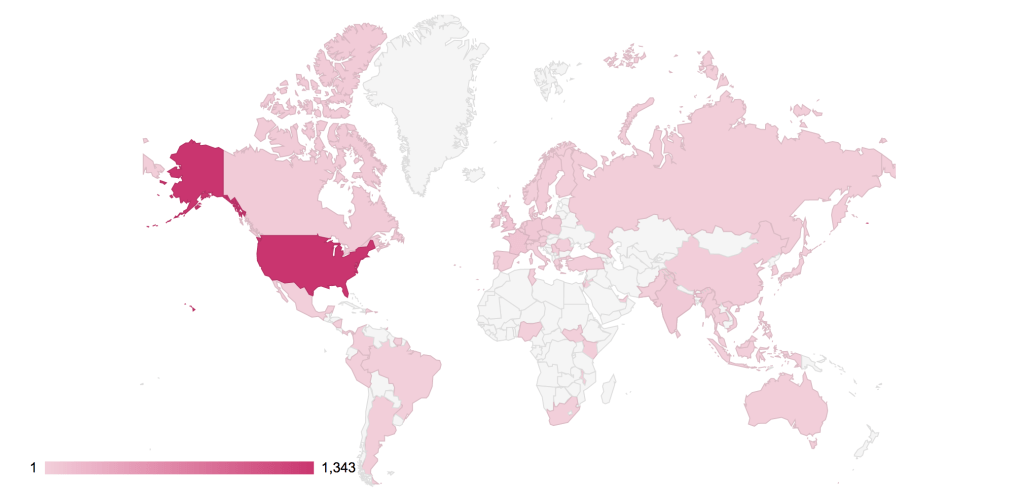
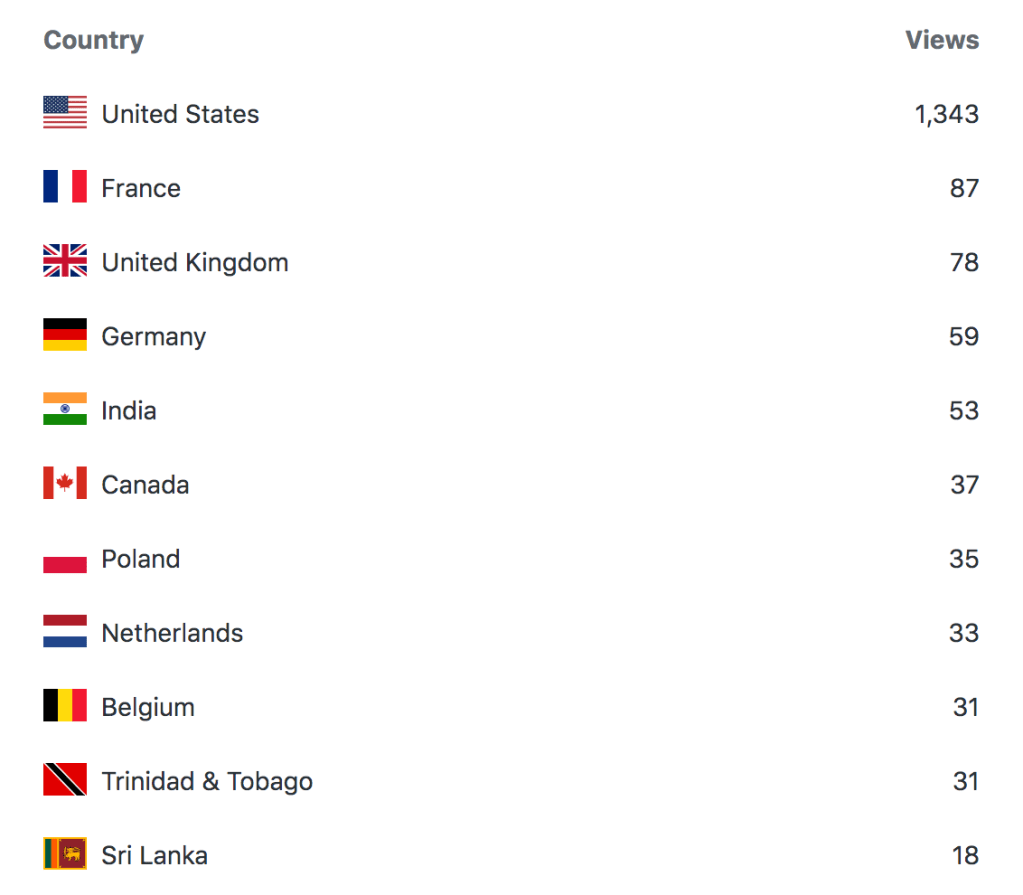
I, and most of the people that I know, are in the United States, so I expected that most of the views would be from the United Stated. However, it is amazing to see that many people all over the world, so far away from me, have also read my blog.
Thank you all once again for following along with me this year and reading the recap of my year with this blog. Happy New Year!

Thanks for sharing. And all the best in 2020.
LikeLike