
A Look at COVID-19 Search Behavior in 2020
As a search engine optimization (SEO) specialist, I am always interested in understanding how people search online, and the motivations and reasons behind their searches. Therefore, I was excited to look at “Year in Search 2020” by one of my favorite free SEO tools, Google Trends.
To no one’s surprise, coronavirus-related queries accounted for three out of the top five trending searches of the year. This was interesting to me as I have a preference to search “covid” over “coronavirus” and have observed more instances of people using “covid” over “coronavirus” on the internet in general. This made me wonder, was there a preference in how people searched for COVID-19 on the web?
Instead of going into Google Trends and comparing search interest for both terms, I decided to use R. I recently learned about the ‘gtrendsR’ package which retrieves data from Google Trends; a package that I really wanted to try out for myself.
Using ‘gtrendsR’ in R is very easy. Once installed and loaded in R, all you need to do is call the gtrends() function on the search terms you are interested in, the country you want data from, and the timeframe as seen below. (There are other arguments that can be used with gtrends() which can be found in its documentation.) Click here to follow along with my full reference code.
Here is the code for retrieving data for “covid” and “coronavirus” from Google Trends using gtrends():
res <- gtrends(c("covid", "coronavirus"), geo = "US", time = "2020-01-01 2020-12-29")
Now, let’s take a look at this in a plot to see how users in the U.S. have been searching for these terms in 2020:

Before we proceed any further, for those who have never used Google Trends before, I do want to define how search interest is defined according to Google Trends: each data point is divided by the total searches of the geography and time range it represents to compare relative popularity and the resulting numbers are then scaled on a range of 0 to 100 based on a topic’s proportion to all searches on all topics.
Looking at the graph above, we can see that when quarantine started in the U.S. back in March, there was a spike in search interest for both terms, but a significantly higher spike for “coronavirus.” This is probably why overall search interest for the year is higher for this term. Search behavior changed in the summer where search interest for “coronavirus” dropped below “covid.” While search interest for these terms in general declined throughout the year, the majority of searches now are for “covid.”
COVID-19 is the official abbreviation for the virus, so it’s possible that since people were more informed about the virus than they were at the beginning of the year, they began searching about it in a more informal manner.
Another thing I wanted to investigated were the top related search queries for each of these terms. Luckily, the ‘gtrendsR’ package also provides you with a data column called “related_queries.” Using R, I manipulated the data table to only contain the top 5 related queries for each of these search terms. Take a look at the table below:
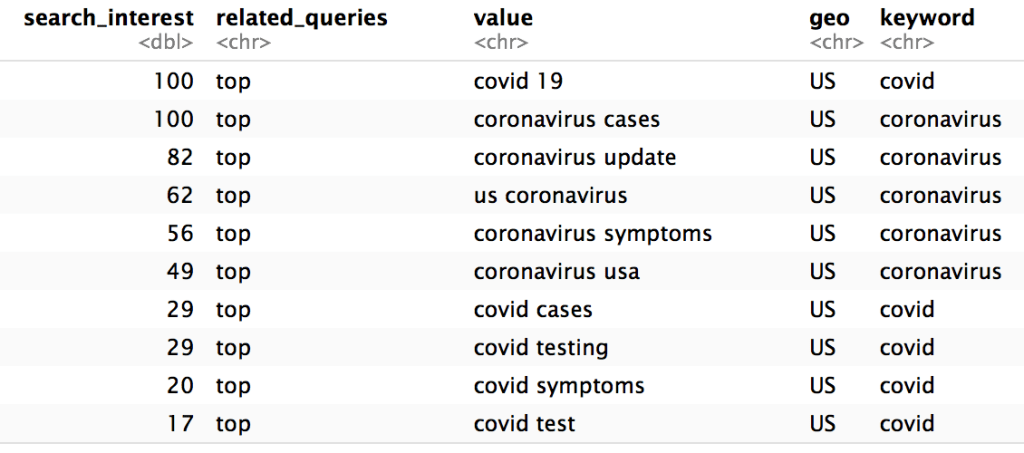
For “coronavirus,” the top five related search queries were: “coronavirus cases,” “coronavirus update,” “us coronavirus,” “coronavirus symptoms,” and “coronavirus usa.” For “covid,” the top five related queries were: “covid 19,” “covid cases,” “covid testing,” “covid symptoms,” and “covid test.”
Using gtrends(), I retrieved search interest over time data for these related queries. Let’s take a look at how these related queries compare to their main queries. To keep things simple, I will only plot the top three related queries with their main query.
Plot of search interest for “coronavirus” and its top three related queries over time:
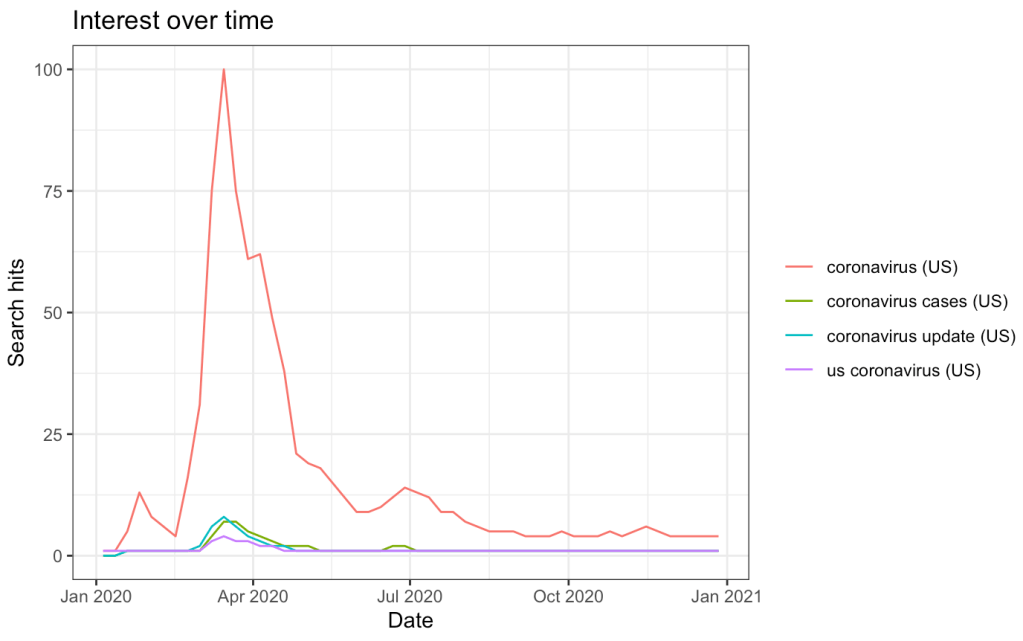
As we can see from the plot above, search interest for “coronavirus” significantly outperformed search interest for it’s related queries. Additionally, those queries also saw a decline throughout the year. As the virus became a part of the new normal, users seemed to search less for specifically for “coronavirus” updates, cases and the virus in the U.S.
Now, let’s take a look at the plot of search interest for “covid” and its top three related queries over time:

Unlike the previous graph for “coronavirus” and its related terms, these terms had different trends. As we already know from the first graph, search interest for “covid” fluctuated throughout the year and we can see here that it had a greater search interest than its related queries. Even search interest for “covid 19”, the official abbreviation for the virus, was lower and declined after a peak in March, with one smaller peak in the summer.
Search interest for “covid cases” remained pretty consistent during the year, which contrasts with the decline we saw from “coronavirus cases”; another example that people are now searching for “covid”-related terms more than “coronavirus.” Lastly, search interest for “covid testing” has increased, which makes sense since testing was not widely available at the beginning of the pandemic, and pretty much anyone can search where to get a test done now.
One final set of search queries I wanted to examine were “coronavirus vaccine” vs “covid vaccine” to see if they showed a similar comparison as “coronavirus” vs “covid.”

In fact, we do see a similar swap from a small spike in search interest for “coronavirus vaccine” at the beginning of the pandemic, aligned with there being little information about a vaccine, to a significant spike in search interest for “covid vaccine” at the end of the year, aligned with the announcement and first administrations of a COVID-19 vaccine. It seems that as people have become more familiar with the virus, they don’t feel the need to call it by its official name anymore.
I hope you enjoyed this quick investigation of U.S. online user search behavior for COVID-19 throughout 2020, and that you’ll explore more in Google Trends or R for yourself. And more importantly, here’s to brighter and more promising online searches in 2021!
