
Last week’s R-Ladies NYC Meetup was one focused on productivity and presentability. The evening consisted of two talks, both by Biostaticians of Memorial Sloan Kettering Cancer Center, with Jessica talking about her timetrackR Shiny app and Margie talking about the {gtsummary} package.
timetrackR Shiny App
Ever wonder where time was going and what you were spending your time on? Ever wanted a way to track and represent your time in a customizable way so you could plan your time better in the future? When Jessica created the timetrackR Shiny app, this is exactly what she was trying to do – to create efficiency at work.
Using the Shiny app, an R package that allows you to build interactive web apps directly in R, Jessica created the timetrackR Shiny app. This app is basically a dashboard with visualizations of current and upcoming projects, time spent on projects by person or time and a project timeline. The ability to filter by person or year makes it a great time tracking app for work.
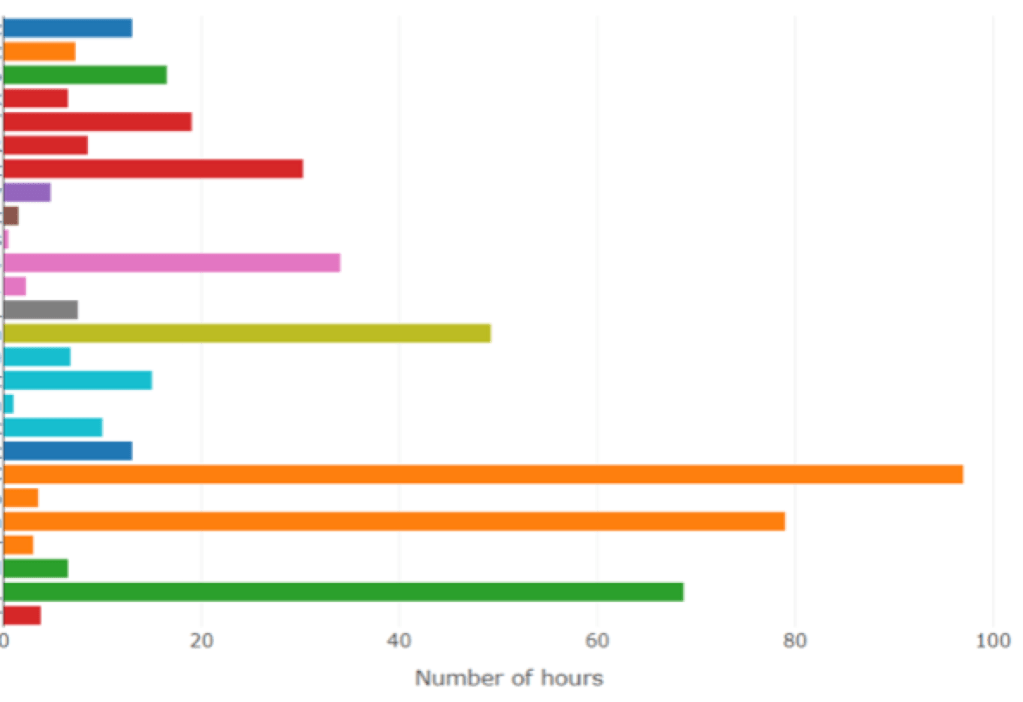
timetrackR focuses on three main metrics to inform you of how your time is spent. Percent Effort, displayed as a pie chart, gives insight into what percentage of time you are spending on a project and whether or not you need to re-prioritze tasks. Total Hours, displayed as a bar chart, allows you to analyze total time spent on projects, what their outcomes were and whether or not to proceed with them. And lastly, the Project Timeline, represented as a gantt chart, provides the big picture of when and how much time was spent on projects.


https://github.com/jalavery/timetrackR/blob/master/RLadies%20timetrackR%20Presentation.pptx
Why use the timetrackR Shiny app? Unlike existing software, where you have to pay for advanced features and use predetermined metrics, timetrackR is free, allows to you have complete ownership and customize metrics.
Currently, in order to use the app, you have to log hours in an excel file and then load it into R. However, Jessica is working to update the app to import data directly from the Toggl time-tracking web app. Check out Jessica’s Github repository so you can try out the timetrackR app for yourself!
{gtsummary} Package
If you have done data analysis in R before, you know that presenting summary statistics and regression results in a table can be messy. Trying to customize these tables to make them publication-ready can require a lot of code and time. This is the problem that Margie and her colleagues solved by creating the {gtsummary} package.
The {gtsummary} package uses RStudio’s {gt} package, a package for printing highly customizable tables. While the {gt} package is a step up from manually customizing table results, it was still not enough to address the needs of Maggie and her team. With that, {gt}’s companion {gtsummary} was created.
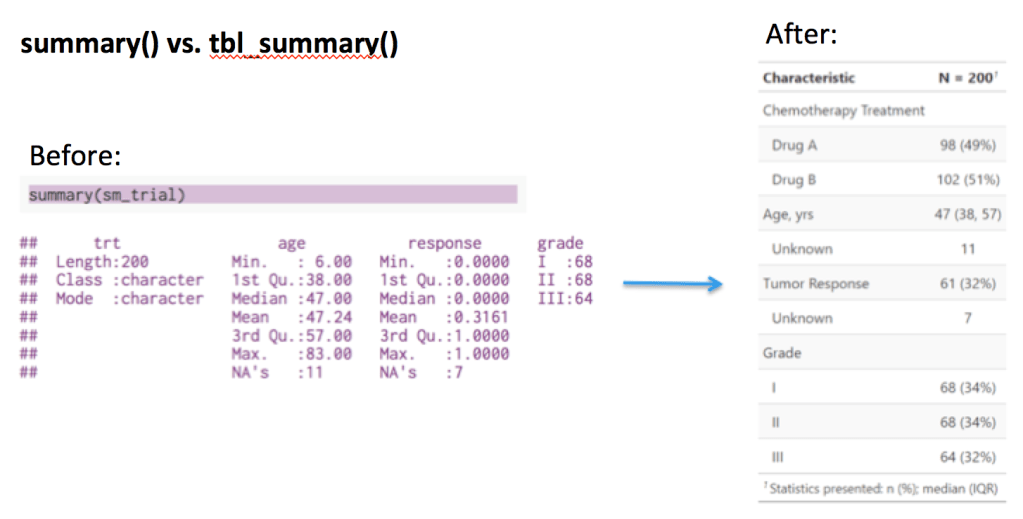
{gtsummary} includes many useful functions like tbl_summary() to summarize data, tbl_regression() to summarize models, tbl_uvregression() to summarize univariate models and inlinetext() which allows you to extract a statistic from your {gtsummary} table and report it in a R Markdown file. Let’s take a look at the difference between a regular summary table and a {gtsummary} table:
https://margarethannum.github.io/gtsummary-presentation-rladies/#1
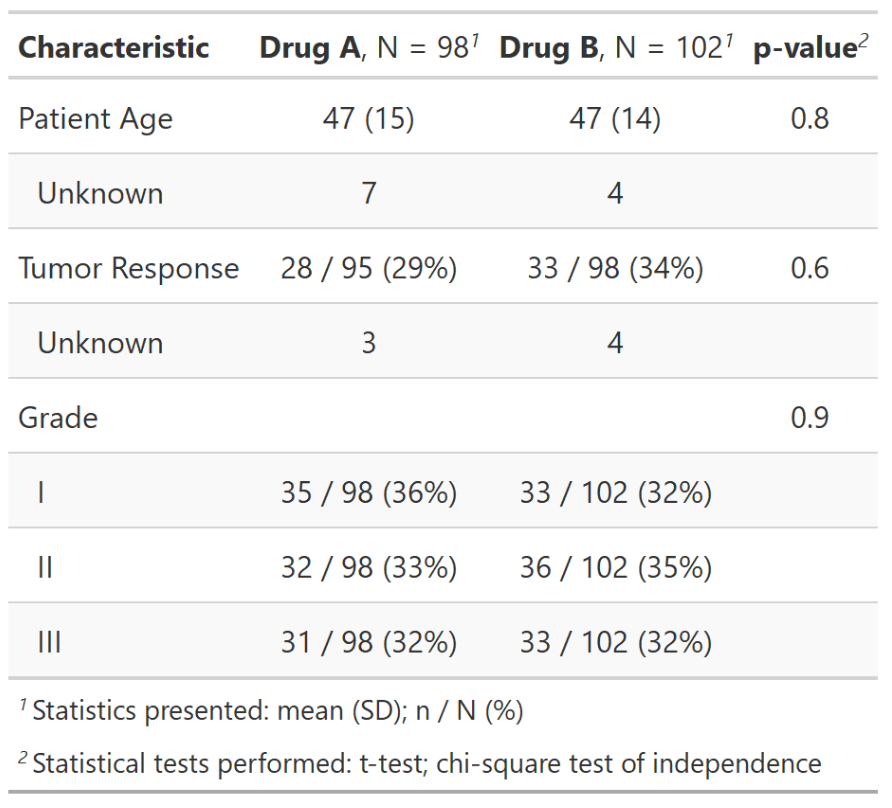
HUGE difference right? Beyond making beautiful tables, the {gtsummary} package also allows you to customize your tables with formulas and tidy functions by using pipes. Take a look at the new version of the {gtsummary} table that is now split by treatment, has a p-value column and additional formulas applied to the statistics.
The {gtsummary} package really does wonders for creating presentable summary statistics and regression results. Try the {gtsummary} package for yourself and view Margie’s full presentation here.
Both R-Ladies presented new R tools that can be beneficial to anyone who uses R. I hope you find uses for both timetrackR and {gtsummary} in your every day workflow.
