
What is a Tibble?
You may be familiar with the old data frame in R. Well, tibbles are data frames, but with some tweaks to make it a little more modern. As part of the tidyverse, the tibble is a great complement to other tidy packages for data wrangling on large data sets and everyday data analysis.
How do data frames and tibbles differ? One important characteristic of tidy data is to store variables in a consistent way. So, unlike data frames, a tibble won’t change variable names or types. A tibble will, however, tell you when a variable is missing, which is ideal for when you are data cleaning.
Additionally, tibbles allow unusual variable names that typically aren’t valid in R. So, try naming a variable “:)” or a number and feel free to be creative.
How do you create Tibbles?
Before you can create a tibble, you need to have the tibble package installed and loaded into R. The tibble package is a part of the tidyverse, so once you have the tidyverse loaded, you will be ready to go!
Creating a Tibble from a Data Frame
In case you are working with a data frame that you want to change into a tibble, it is possible to change it with as_tibble(df_name).
Since, the tibble is a modern version of the data frame, you may encounter some older functions that do not work with the tibble. For this, you can easily convert back into a data frame with as.data.frame(tb_name).
Creating a Tibble from a Vector
You can also turn individual vectors into tibbles using the tibble() function. Tibble() reads through the data sequentially by an input length of 1, so it is important to order your variables accordingly.
For example, let’s say you had vector x = 1:10, vector y = 2 and vector z = x + y. Vectors x and y would have to precede z in your tibble, since z contains elements of both x and y. Let’s see what this tibble would look like:

Creating Tibbles with Tribble()
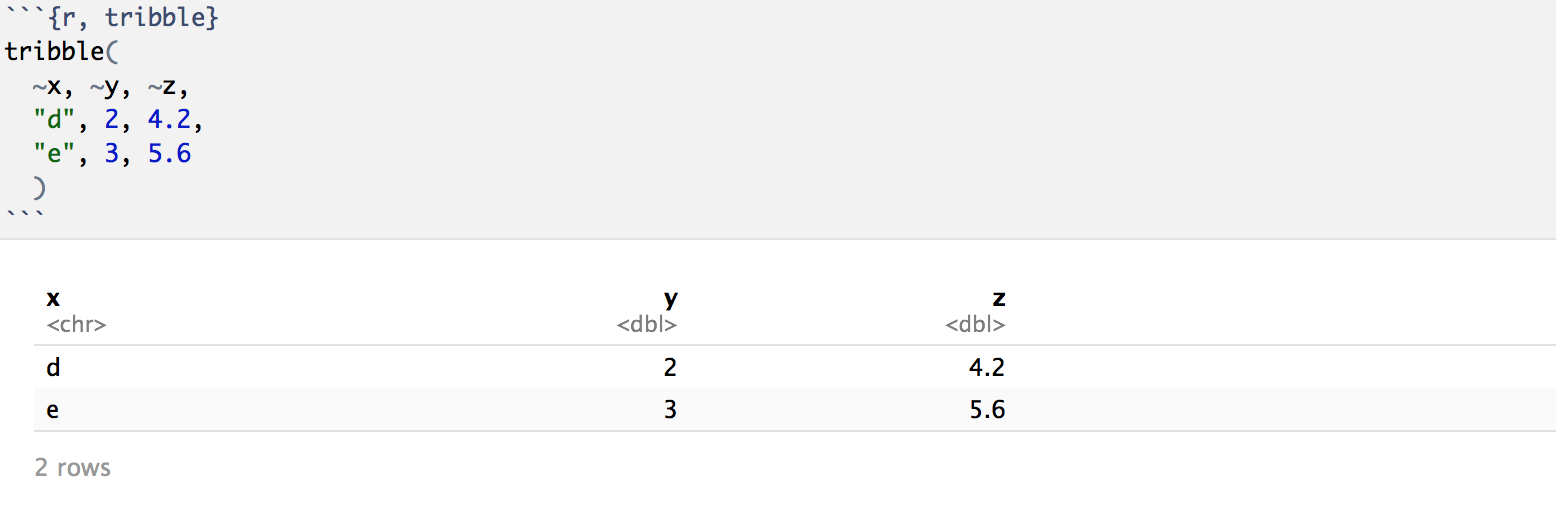
Another function for creating tibbles is the tribble() function; short for transposed tibble. Instead of inputing vectors one row at a time as we did with the tibble() function, you enter it one column at a time (transposed) similar to how you would see the resulting tibble.
Two rules when using the tribble() function are: 1) column names must be defined by functions or tildes (~) and 2) data elements must be separated by commas.
Let’s see an example:
Printing Tibbles
As you begin to work with tibbles, you will notice a difference in how tibbles are printed versus data frames.
When you print a tibble, only the first 10 rows are displayed in the results. This is ideal when working with large data to prevent your console from crashing. (Something that’s happened to me many times with large data frames!)
Subsetting Data from Tibbles
Once your tibble is ready, you will want to subset data for your analysis. There are two keys ways to extract specific data from a tibble: by column name and position.
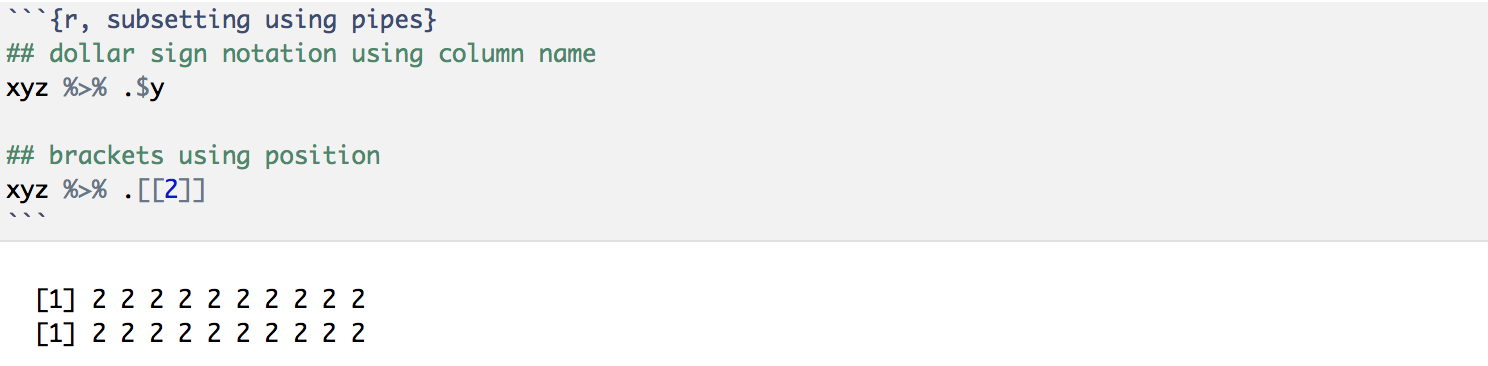
When subsetting by column name, you can either use the dollar sign notation, tibble_name$column_name, or brackets, tibble_name[[“column_name”]]. When subsetting by position, you just use the brackets, tibble_name[[#_column_position]].
One important distinction to note when using pipes to subset a tibble – you can either subset by column name or position, but you will need a special placeholder “.” before these elements. Let’s extract column “y” from our first tibble:
Now that you know about tibbles and how to use them, you can use them for your next “tidy” project! Click here for reference code.
